In order to understand geology, we need to think about the rocks below our feet in three dimensions. Those spatial relationships— what’s on top of what, how rocks are faulted or folded— give us all kinds of interesting information. While maps are useful in all kinds of ways, they’re a little lacking in the 3-D department. So when we’ve measured the orientation of a rock layer, we need a way to represent that on a map. Here’s a basic primer on how that’s done.
The geological lingo for this is “strike and dip”. The words may be confusing at first, but it’s really quite simple. Let’s start with some nice, horizontal sedimentary rocks. Pretend the top of this block is the surface of the Earth. Picture a kangaroo hopping across it, if that helps or entertains you.

Let’s picture a single layer of that rock and tilt it downward to the right. The tilt of that layer is what we call “dip”. We describe this layer as dipping to the right, because that’s the direction it’s tilted downwards toward. We measure the dip as the angle between the layer and horizontal.

Now, let’s try to imagine looking at that same tilted layer from directly above it. Again, it’s dipping downward to the right. Draw a horizontal line across that layer— that’s what we call the “strike”. (Don’t worry about why we use that word.) In this example, the strike is north-south. That means this layer is dipping to the east.

Here’s a block made of tilted layers instead of horizontal ones. The top of the block is still the surface of the Earth, but I’ve sliced out a piece of the block to help us visualize this better. Imagine you’re looking at a cliff.

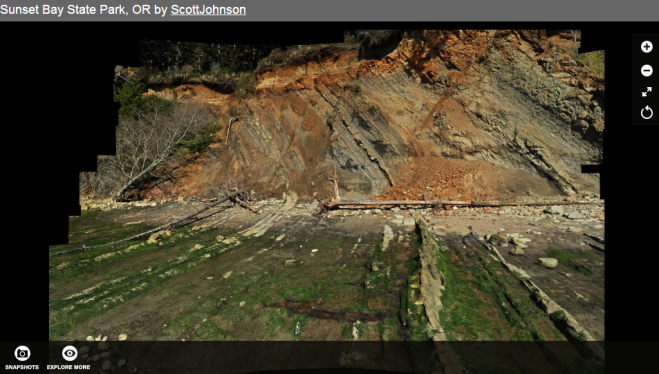
When you look at the side of the block, you can see the dip. When you look at the top of the block (the surface), you can see the strike. Click the image below to explore a real outcrop of sandstone and siltstone from the Oregon coast that looks a lot like this. Be sure to zoom in and get a closer look.
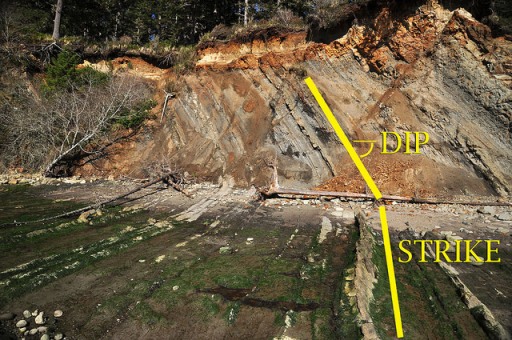
Here’s an annotated image of that outcrop, just to make sure you can see the strike and dip. You can click on this image to see more photos from this spot. If you click this link, you can check out the area with Google Earth.
Geologists carefully measure the strike and dip on an outcrop like that using a tool called a Brunton compass, pictured below.

Once you’ve made the measurements, you can display them on a geologic map— which was our goal at the start of this post. Strike is easy enough, since it’s a compass direction. If we measured the rock striking north-south, we would draw a short, vertical line on the map in the location of our measurement (assuming up is north). If the rock was dipping 45 degrees to the east, we would add a tick mark at the midpoint of our strike line, pointing east. Think of the tick mark as an arrow pointing in the direction a ball would roll if you could set it on that rock layer. Just below that we would write the measured dip: “45”. It would look something like the example below. The different colors on the map represent the different rock layers exposed at the surface, just like looking at one of the block diagrams from above. Without the strike and dip symbol, we would have no idea if those layers were dipping to the west, to the east, or were vertical. But by adding this simple symbol, we can understand something about the 3-D orientation of the rocks.

Hat tip to Lockwood DeWitt for giving me the idea for this post.


